An explanation of low forecasted returns
The financial news media has devoted considerable attention to the historically low level of interest rates and the implications for future investment returns. One such recent article was titled ‘Worst-case scenario warning for retirees and the 4% rule’. Expectations for future investment returns are critical in making decisions about the future beyond the obvious one of deciding how to invest. Decisions about retirement, home financing, and gifting to younger generations family members are often shaped by expectations for future investment returns. Our ten-year return forecasts (shown below) for U.S. bonds and stocks may surprise and disappoint some clients. Here we explain why we expect future investment returns to be lower than the past.

We focus this analysis on the core of our clients’ portfolios: U.S. bonds and stocks. Specifically, we use U.S. Treasury bonds and the S&P 500 index. Treasury bonds, given their lack of credit risk and liquidity, are a building block on which other asset prices are based. The S&P captures much of the U.S. stock market. Both series have long histories helpful for study.
The essence of this analysis is that expected future bond returns are low when the starting interest rate is low as it is today, and expected future stock returns are low when the starting price is high relative to earnings as they are today. These are similar stories. Bond investors aren’t getting much interest for their investment and stock investors aren’t getting many earnings for their investment both of which diminish expected returns.
Bonds
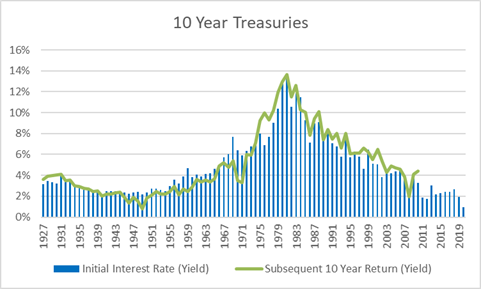
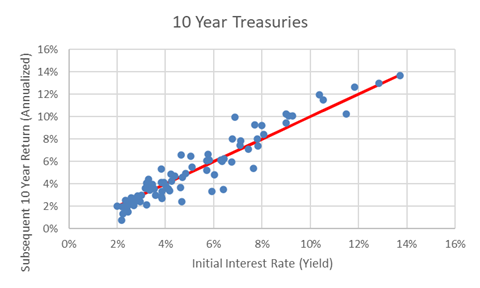
Figures 1 and 2 illustrate data from Aswath Damodaran of New York University. The columns in the first figure represent the initial rate on 10 Year Treasuries at the start of a year and the line represents the return to an investor who held 10 Year Treasuries for ten years. Figure 2 visualizes the correlation of this beginning interest rate to the subsequent actual 10 year return. Both figures show that when initial rates are low investors tend to earn low returns on Treasuries in future years.


Stocks
The cyclically adjusted price-to-earnings ratio (CAPE) was popularized by Nobel Laureate and Yale University professor Robert Shiller. It is the price of the S&P 500 stock index divided by the average of the previous ten years of inflation-adjusted earnings. The price-to-earnings ratio measures the number of dollars investors are willing to pay for one dollar of earnings. High ratios are generally considered expensive while low ratios can broadly be considered a bargain. Averaging ten years of earnings smooths the short-term volatility. We will show here that the CAPE helps predict future stock market returns as represented by the S&P 500 index. When the CAPE has been high, investors have been willing to pay more for earnings and future returns have tended to be less than when the CAPE is low.
The following charts say similar things in different ways. We present these because readers will have different preferences. We start simply by aligning the return of the S&P 500 (source: DFA) over the next ten years with the CAPE. We have used total returns (i.e., dividends and appreciation) for the S&P from 1926 through April 2021. This makes the ending date for the chart Apr 2011. It is clear in Figure 3 that high values of CAPE have generally been associated with low future returns and low values of CAPE have been associated with high future returns.

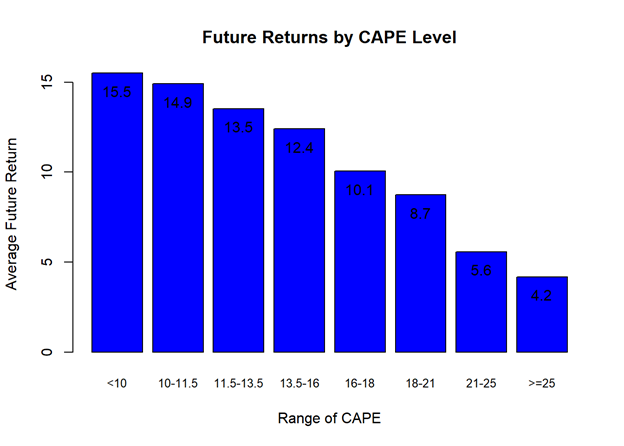
Next, we begin to quantify the relationship between the CAPE and future returns. Figure 4 shows the average future return of the stock market based on ranges of the CAPE. The ranges of the CAPE ratio in the plot were chosen so that close to an equal number of observations would fall into a group. Given that the current CAPE of 37 falls in the >=25 bin, we might expect something like a 4.2% return.

Finally, for the statistician, we provide, in Figure 5, a scatterplot and a regression line with confidence intervals. Each circle represents the CAPE for a particular month and the return of the stock market over the following 10 years. The circles are color coded to represent approximately a 20 year period. The red line is the best-fit regression line through all the data. The gray lines are the upper and lower confidence intervals. The vertical dashed line is the recent CAPE value. This graphic adds color both literally and figuratively. The more recent data (cyan) suggest that the relationship between future market returns and CAPE are different (higher) than in other periods. One can speculate about differing monetary policies (gold standard, Volcker) as potential causes. Regardless, higher CAPEs have historically been associated with lower future returns. Using all the data, the regression line indicates that each change of 1 in the CAPE reduces the future 10 year annual return by a bit more than one-half of one percent.
Figure 5 shows the 10 year estimated return given the current CAPE of 37 would be -0.4%. The 90% confidence interval is -6.6% to 5.9%.

Figure 6 is identical to the previous plot except it only uses the data beginning 1986. This produces a more optimistic forecast. One theory for the changed relationship is that better policies from the Fed beginning with Volcker have reduced macroeconomic uncertainty which leads to higher valuations in markets. Naturally, there is nothing to say that the theory is wrong or that policy will not change for the worse in the future.
With this model the 10 year estimated return given the current CAPE of 37 would be 1.3%. The 90% confidence interval is -2% to 4.5%.

Summary
History and theory indicate low future returns in the U.S. Given this expectation, here is our counsel:
- The future may surprise us with better than expected returns. Forecast error leads us to diversify so we believe in keeping some exposure to the U.S.
- Five companies (Facebook, Apple, Alphabet, Amazon, and Microsoft) comprise nearly 24% of the weight of the S&P 500 index (source: Vanguard Q2 2021 Chartbook). The performance of U.S. stocks as measured by a different index may perform better. For example, it may be that value stocks outperform the capitalization-weighted S&P 500 index. For this reason, we consider allocations to U.S. stocks that are not as heavily weighted to higher priced names.
- Invest beyond the U.S. because yields are more attractive.
- Remember that our forecasts span a 10 year horizon and returns in the meantime will differ markedly from this expected average.
Disclosures
The analysis in this report has been prepared by Red Tortoise LLC utilizing data from third parties. Reasonable care has been taken to assure the accuracy of the data contained herein and comments are objectively stated and are based on facts gathered in good faith; however, Red Tortoise cannot guarantee the accuracy of such information and has not independently verified the accuracy or completeness of such information or the assumptions on which such information is based. Red Tortoise disclaims responsibility, financial or otherwise, for the accuracy or completeness of this report. Opinions expressed in these reports may change without prior notice and Red Tortoise is under no obligation to update the information to reflect changes after the publication date.
This report is being made available for educational purposes only and should not be used for any other purpose. Nothing contained in this material is intended to constitute legal, tax, securities, or investment advice, nor an opinion regarding the appropriateness of any investment, nor a solicitation of any investment advisory services or an offer to sell or solicitation to buy any securities or related financial instruments in any jurisdiction. The general information contained in this publication should not be acted upon without obtaining specific legal, tax, and investment advice from a licensed professional.
Past performance is no guarantee of future results. Forecasting represents predictions of market prices and/or volume patterns utilizing varying analytical data. It is not representative of a projection of the stock market, or of any specific investment.