When dramatic events hit the headlines—wars, oil shocks, political unrest—investors often ask the same question: How should we respond? History suggests the answer is usually simpler than it feels. One of the clearest lessons comes from an unlikely place: the sinking of the Titanic.
A World Without Instant News
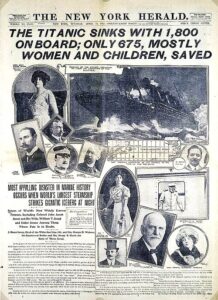
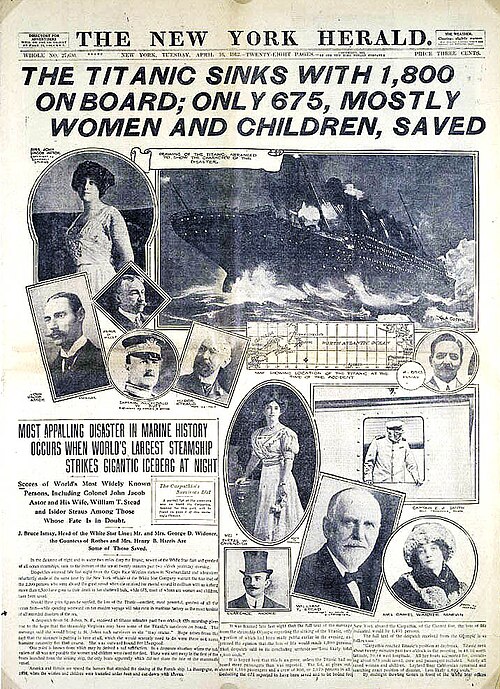
To understand the lesson, it helps to remember how different the world was in 1912. There was no internet. No television. No social media. Newspapers were the primary source of news, and information traveled slowly. Telephones existed, but mostly for businesses and the wealthy. Global communication depended largely on the telegraph. Still, technology was advancing. The Titanic was equipped with Marconi wireless radio, allowing it to transmit messages over long distances—an impressive innovation at the time. On April 14, 1912, the ship struck an iceberg shortly before midnight. Within hours, the news began to spread.
How Markets Responded
The Titanic was owned by the White Star Line, which in turn was controlled by International Mercantile Marine (IMM). The ship cost about $7.5 million to build and was insured for $5 million, leaving a net loss of roughly $2.5 million.
What happened to IMM’s stock?
A later economic analysis[i] found that over the two trading days following the disaster, IMM’s market capitalization fell by approximately $2.6 million—almost exactly matching the economic loss from the ship itself, after adjusting for overall market movements.
In other words, the market absorbed shocking news, processed it, and priced the damage with remarkable accuracy—over a century ago.
This is a small sample size, of course. But the lesson is powerful.
Markets Price Expectations, Not Certainty
Markets don’t know the future. They don’t predict events with perfect foresight. Instead, prices reflect expectations. When new information arrives—especially information that differs sharply from what investors expected—prices adjust. Sometimes dramatically. Often very quickly. The greater the gap between expectations and reality, the larger the market reaction.
This dynamic hasn’t changed. Only the speed has.
When Prices Move Before the Headlines
Today, information travels instantly. In some cases, markets appear to move before news becomes public.
This is more obvious in smaller or less regulated markets, such as online prediction markets. In several high-profile cases, large bets were placed shortly before major geopolitical events became public, generating significant profits for a handful of participants.
According to reports in Cointelegraph[ii] a “Polymarket account reportedly earned about $400,000 after placing a large wager on the capture of Venezuelan President Nicolás Maduro shortly before the news became public.” The Daily Hodl[iii] reports that six suspected insiders generated approximately $1.2 million betting on a U.S. strike on Iran. The accounts were funded within 24 hours, placed “yes” bets hours before the strike and targeted a February 28 outcome.
This behavior has been observed not just in prediction markets, but also in traditional financial markets and in academic research on trading behavior. What follows touches on politics, but the point here is economic, not political. If markets move before the news, it is pointless to trade after the news. Apparently, some of our lawmakers trade before the news is public. The evidence is pretty convincing.
- Senators traded immediately after closed‑door COVID‑19 briefings, selling millions in stock before the public understood the scale of the threat (ProPublica; NPR).
- A New York Times investigation found that 97 members of Congress or their families traded stocks in industries they directly oversaw — often just before major legislative or regulatory actions.
- Peer‑reviewed research in the Journal of Financial and Quantitative Analysis shows lawmakers have historically earned abnormal positive returns, suggesting access to information the public doesn’t have.
- Even in the executive branch, officials like Commerce Secretary Wilbur Ross and HHS Secretary Tom Price faced scrutiny for trades that aligned closely with upcoming policy decisions or unpublished news (NYT; WSJ; ProPublica).
An Uneven Playing Field
Evidence shows that when information is unevenly distributed, those with earlier or better access have an advantage.
The important takeaway for most investors isn’t outrage—it’s realism.
If prices move as soon as credible information enters the system, then reacting after the headline appears is often too late. Markets may be efficient, but they are not egalitarian. Understanding that difference matters.
The Enduring Lesson
The sinking of the Titanic reminds us that markets are information machines, not crystal balls.
They don’t forecast the future with certainty, but they are highly efficient at absorbing new information and translating it into prices—sometimes faster than the public realizes.
For investors, the implication is straightforward: long-term success is more likely to come from focusing on fundamentals, discipline, and time horizons—not from chasing headlines.
Endnotes
[i] The economic analysis summarized here is taken from: Khanna, A. (1998). The Titanic: The Untold Economic Story. Financial Analysts Journal, 54(5), 16–17. ↩︎ back
[ii] Polymarket User Profits And Disappears After Big Maduro Bet↩︎ back
[iii] Kalshi and Polymarket ‘Death Carveout’ Triggers Controversy, Insider Trading Allegations Related to Iran Airstrikes – The Daily Hodl↩︎ back