| Company | Ticker | % Change (2022) |
| Apple | AAPL | -27% |
| Amazon | AMZN | -50% |
| Microsoft | MSFT | -29% |
| Tesla | TSLA | -65% |
| Meta Platforms | META | -64% |
| Nvidia | NVDA | -50% |
| PayPal | PYPL | -62% |
| Netflix | NFLX | -51% |
| Walt Disney | DIS | -44% |
| Salesforce | CRM | -48% |
| S&P 500 | -18% |
Table 1 (source: the Visual Capitalist) shows the largest losers in the S&P 500 in 2022. The index itself lost just over 18%. Many of these companies, if not all, would be considered great companies. This is evidence that investors can experience significant loss even investing in great companies; and, great companies can do worse than the market average.
2022 was a single year and perhaps an aberration. Research from Dimensional Fund Advisors suggests that the largest companies in the U.S. may underperform in the future, though not to the degree witnessed in 2022.
Figure 1. Largest Stocks at Start of Each Decade
Figure 1 shows the largest 10 US stocks at the start of each decade. The evolution of names is interesting and raises some questions. Do these largest of the large stocks tend to do better or worse than the market? If they tended to do better, then we’d expect little turnover. The big would get even bigger on a relative basis.

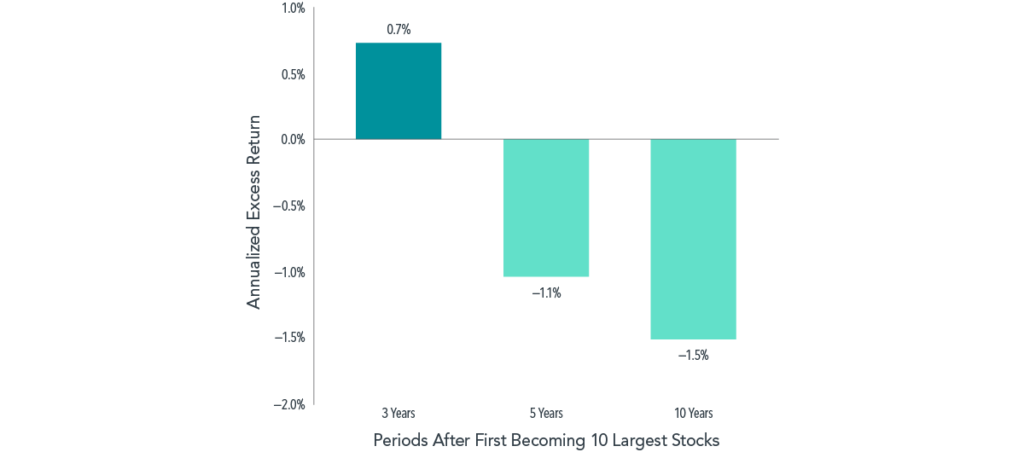
Figure 2. Excess Return (Annualized)
Figure 2 shows the annualized return in excess of market for stocks after joining list of 10 largest US stocks from 1927–2019. Over the longer periods these stocks tend to underperform.
We are not anti-large companies. We are for anti-concentrating wealth in large companies. We are pro-diversification. One additional piece of research supports our approach. In his May 2018 paper, “Do Stocks Outperform Treasury bills?”, Hendrik Bessembinder of Arizona State University states that since 1926:
- The majority of common stocks have lifetime buy-and-hold returns that are less than one-month Treasuries.
- In terms of lifetime dollar wealth creation, the best-performing 4% of listed companies explain the net gain for the entire US stock market as the performance of other stocks collectively matched U.S. Treasury bills.
- The findings help to explain why poorly diversified active strategies most often underperform market averages.
The concentration of wealth creation in a small percentage of companies is not widely appreciated. The track record of active managers trying to outperform the market index is poor which is why index funds have become popular. Table 2 shows just how poorly the vast majority of active U.S. large-cap fund managers have failed to beat the S&P 500 index over the long-term:
| 1-Year | 3-Year | 5-Year | 10-Year | 15-Year | 20-Year |
| 55% | 86% | 84% | 90% | 89% | 95% |
Table 2 Failure Rate (Source: Standard & Poor’s, data through June 2022)
If you want your portfolio to include the small percentage of companies that Bessembinder finds contribute the most to dollar wealth creation, buying all the stocks in the market will do the trick – though one obviously is kissing a lot of frogs to find a prince.
Diversification within a portfolio is not just to reduce risk – it may contribute to return.


