In this post we look at how markets have reacted to the election of Donald Trump and a Republican controlled House and Senate on November 8th. The reaction has been interesting and generally positive. It also highlights one of beliefs at Red Tortoise which is that markets predict the economy better than the economy predicts the markets.
Global Stocks
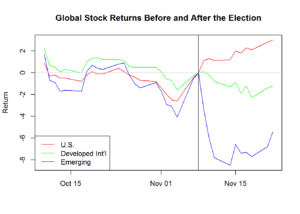
First, let’s look how stocks around the globe have performed before and after the election. For this we’ve picked three funds.
• U.S. stocks are represented by the iShares Core S&P 500 ETF (IVV)
• Stocks of developed international markets as represented by the iShares MSCI EAFE ETF (EFA) where EAFE is an acronym for Europe, Australia and Far East.
• Stocks in emerging markets represented by the iShares MSCI Emerging Markets ETF (EEM)
Election day (the vertical line) is the reference date and all the returns are indexed to zero so that the performance before and after can be visualized easily. None of the markets show a trend in the month leading up to the election. Since the election, the U.S. market has moved up with the developed and emerging markets have declined. From this it seems that the market might be expecting a pickup in the U.S. economic activity. However on the surface this isn’t helping other markets.

Interest Rates
If economic activity is going to pick up then we’d expect interest rates to rise and that is what we see in the following chart.If economic activity is going to pick up then we’d expect interest rates to rise and that is what we see in the following chart.

The Dollar
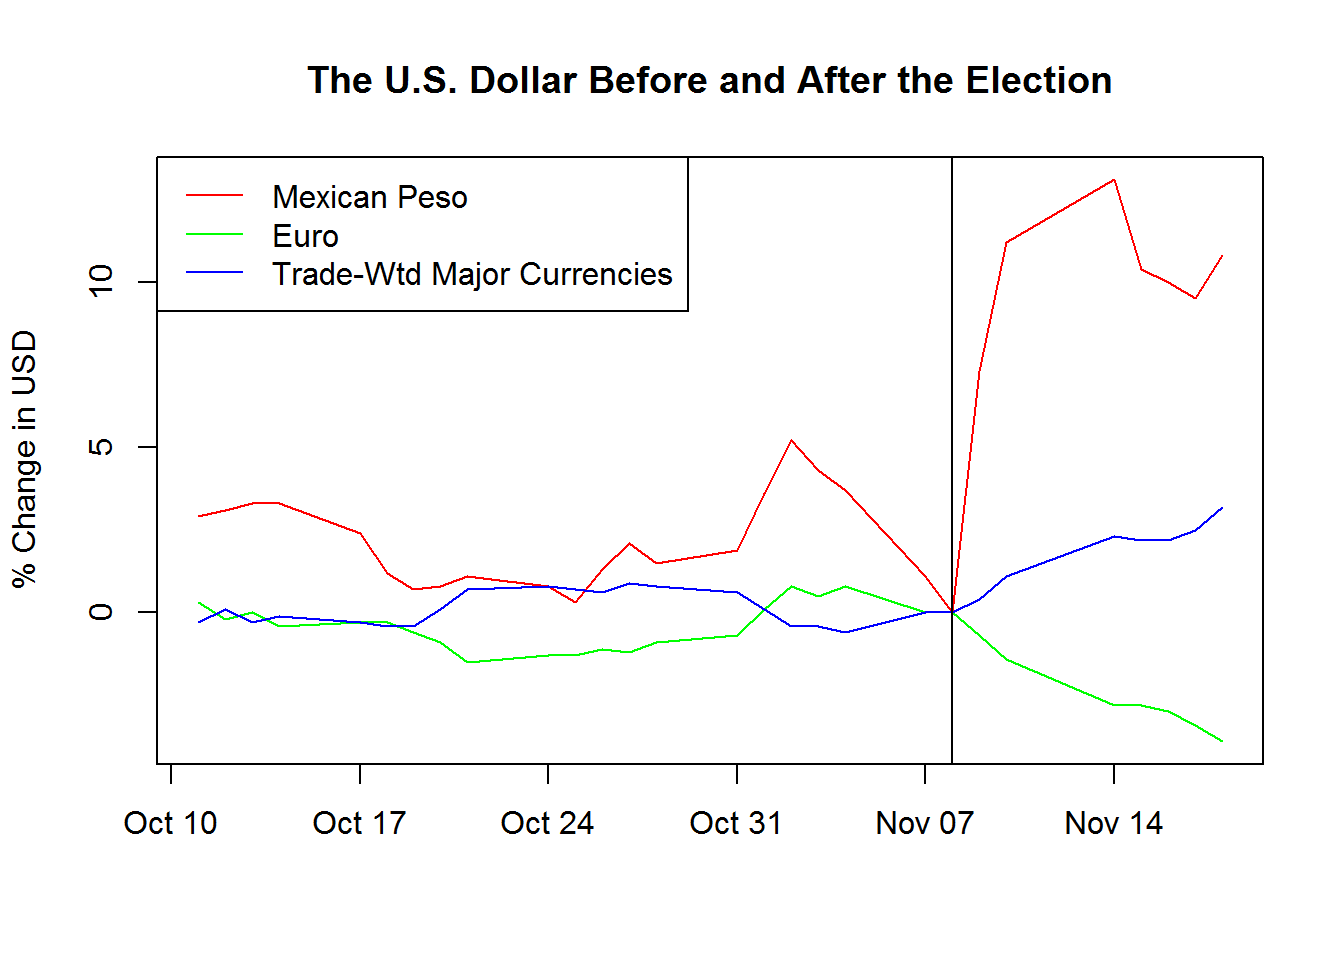
A country’s currency rises when there is demand for that currency by people wanting to consume its products and services or invest there. Since the election the U.S. dollar has appreciated strongly against the Mexican peso. It’s moved up relative to a trade-weighted basket of major currencies, but declined against the Euro.

Inflation
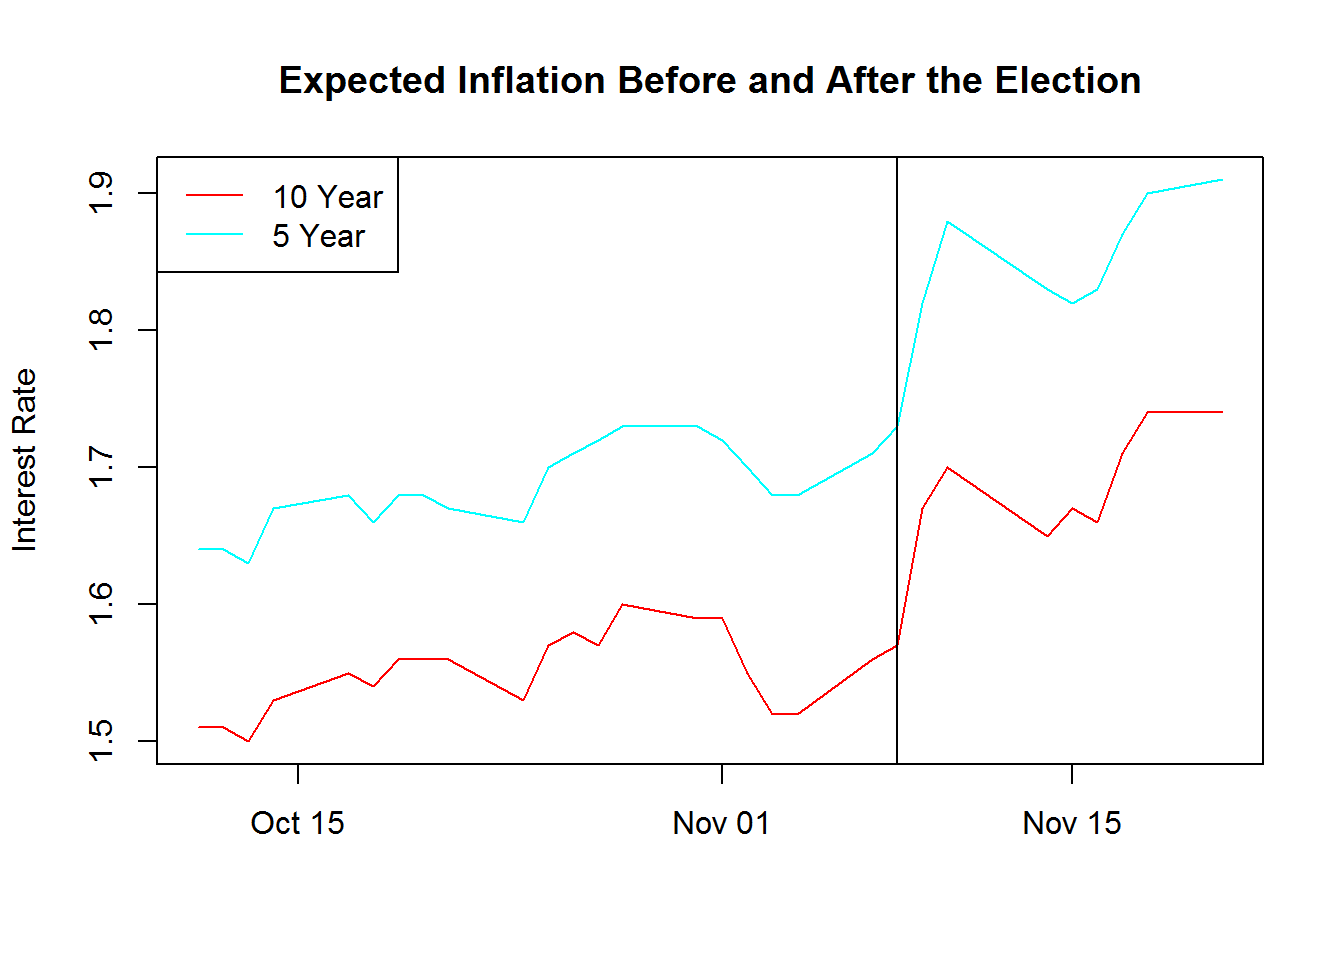
A stronger economy and rising interest rates might be associated with inflationary pressures. A market-based measure of the expected inflation rate can be inferred by taking the difference between the yield of a nominal Treasury bond and an inflation-linked bond of the same maturity. As the chart shows, inflation expectations have ticked up 0.1% to 0.2%.

Disclaimer: Red Tortoise cannot guarantee the accuracy, or completeness of any of the information in this post. Red Tortoise shall not have any liability, contingent or otherwise for the accuracy or completeness of the information or for any decision made or action taken by you in reliance upon the information herein.